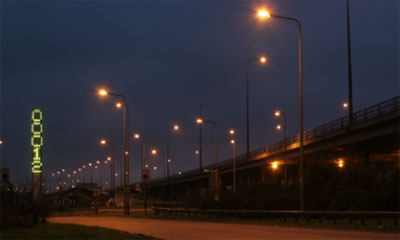
four information display art sculptures located on roundabouts along highways in Essex (UK). each tower senses & responds to environmental stimuli, measuring the light level, wind strength, tide height, amount of traffic & the power generated by nearby wind turbines. a large array of LED lights then displays this data, making people aware of the abstract phenomena in the physical world. presenting such amounts of information in a comprehensible way to cars flashing by is not an easy task, & one could wonder whether the numerical values will be understood. []
 Time and Date follows Time Zone (Brussels)
I'm curious to know how useful/meaningful these displays are. Does anyone have more info about it? It seems that it may just look like random numbers being displayed at any given time.
I'd love to hear how different people in our industry would approach the display of this information.
in its defence, I should mention that these towers were commissioned as art works. clearly, most information designers will consider this as a missed opportunity.
so, bad information design = art?