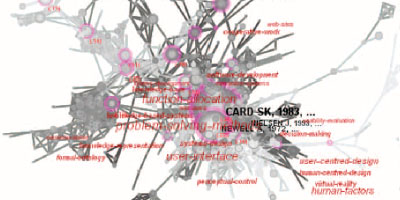
 an interesting recent academic paper, written by information visualization guru , discussing the Top 10 Unsolved Information Visualization Problems. 'problem 7: aesthetics. the purpose of information visualization is the insights into data that it provides, not just pretty pictures. but what makes a picture pretty? what can we learn from making a pretty picture & enhancing the representation of insights? it’s important, therefore, to understand how insights & aesthetics interact, & these two goals could sustain insightful & visually appealing information visualization.'
I am quite glad that aesthetics is becoming an accepted aspect in visualization research. but here is a question for you: is 'aesthetics' (in visualization) more than 'pretty pictures'?
[ & (pdf)]
the Top 10 Unsolved Information Visualization Problems, according to Chamoi Chen:
1. usability: the need to perform usability studies & emperical evaluations on new visualization methods,
2. understanding elementary perceptual-cognitive tasks: studying users' perceptual & cognitive needs when browsing & searching,
3. prior knowledgeon how to operate the visualization & how to interpret its content,
4. education & training: of the general audience by showcasing examples & tutorials to raise the awareness of information visualization's potential,
5. intrinsic quality measures: to benchmark & evaluate new visualization approaches against,
6. scalability: to enable parallel computing & the visualization of large data streams,
7. aesthetics: see the original post above,
8. paradigm shift from structures to dynamics: towards time-varying datasets, data streams & immediate trend-detection,
9. causality, visual inference, & predictions: by specific forecasting algorithms that assist in resolving conflicting hypotheses,
10. knowledge domain visualization: or the communication of knowledge instead of the display of abstract data as information.
 Time and Date follows Time Zone (Brussels)
Wikipedia states, "The form of the work can be subject to an aesthetic as much as the content. With painting the aesthetic convention that we see a three dimensional representation rather than a two dimensional plane is so well understood that most people do not realise that they are making an aesthetic interpretation.
"Although any individual's aesthetic response to a work of visual art will be unique to that individual, many aesthetic principles can be identified and used by the creator of the work to achieve specific aesthetic effects. These include, tonal variation, juxtaposition, repetition, field effects, symmetry/asymmetry, perceived mass, subliminal structure, linear dynamics, tension and repose, pattern, contrast, perspective, 3 dimensionality, movement, rhythm, unity/Gestalt, matrixiality and proportion."
My approach to understanding design is that we don't see the world as it is; we see the world as we are. The benefit of presenting information architecture is that cognitive interpretation can be aided, and is quicker which is necessary these days. Problem is, proffering the information in a more sensationalistic manner, the context becomes open to interpretation now, too.
Via design, this information can be deduced to symbols borne of algorithms, from what I understand. By stripping the information of some of its primary epistemology, you offer room for interpretation.
It's the difference between
THIS and
.%%%%%%..%%..%%..%%%%%%...%%%%..
...%%....%%..%%....%%....%%.....
...%%....%%%%%%....%%.....%%%%..
...%%....%%..%%....%%........%%.
...%%....%%..%%..%%%%%%...%%%%..
or how it's common today for one person to be politically incorrect when they say "nigger" and another to be cultural and rebellious when they say it, based on skin colour.
Information means nothing without context. Like the saying: Kill one man, you're a murderer; kill a million, a conqueror.
If the world is, in fact, more akin to the models presented in phenomenological existentialism or ancient mysticism, then the paradigm of the observer-created reality would imbue more subjective/relative importance upon the context with which aesthetic presents the information.
Science is one thing, but look out the window at all the people and ponder, When has information ever really presented the aesthetic or context?
Of course aesthetics in visualisation is more than 'pretty pictures'! There is a data-driven meaning behind visualisations, unlike arbritrarily pretty images.
(But only if the *intention* is to provide an insightful infovis. If an artwork is created using data, then that's completely different...)