 a novel visual correlation paradigm for situational awareness (perception of elements within time & space, their meaning, & the projection of their future status) for various complex emergency applications such as network alert incident reporting, emergency awareness & biological agent detection.
the concentric rings in the circle represent sequential time samples. this modified tree-ring shows how the presence of biological agents has evolved over time. the inside of the ring structure shows where sensors across the country are set up. the map in the middle enables the correlation of the presence of agents to the sensor that detected it. the correlating line has a variable width that shows the probability of the agent under analysis: the thicker the line the greater the probability of an actual attack. additional information can be shown on the ring to support more complex analysis.
(better images after the break) [ (pdf)]
MORE

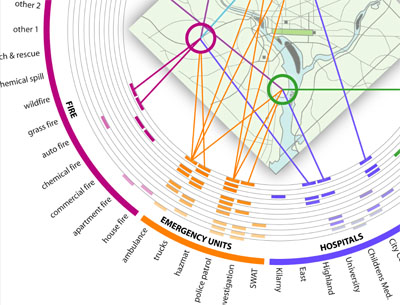
images taken from: Y. Livnat, J. Agutter, S. Moon, S. Foresti. Visual Correlation for Situational Awareness, in IEEE Symposium of Information Visualization, Minneapolis, MN, USA, pp.95-102, IEEE, October 2005.
 Time and Date follows Time Zone (Brussels)
A friend, knowing I did my dissertation on a similar topic - creating visual displays based on information shared in the group - forwarded this site to me.
I anticipate spending a good time exploring what you provide.