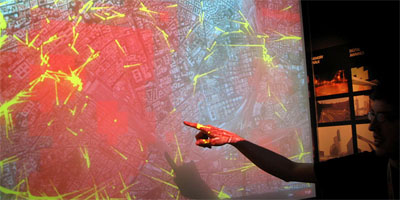
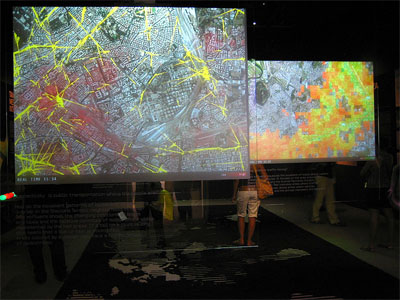
an exhibition at the 2006 Venice Biennale, showing several geographical visualizations of real-time aggregated data from cell phones, buses & taxis in Rome. real-time data is collected from various networks to understand patterns of daily life in Rome, which are overlayed with geographic & socio-economic references. the resulting maps demonstrate how neighborhoods are used in the course of a day, how the distribution of buses & taxis correlates with densities of people, how goods & services are distributed in the city, or how different social groups, such as tourists & residents, inhabit the city.
see also mobile phone landscape graz & ispots wireless map.
[link: ]
 Time and Date follows Time Zone (Brussels)