
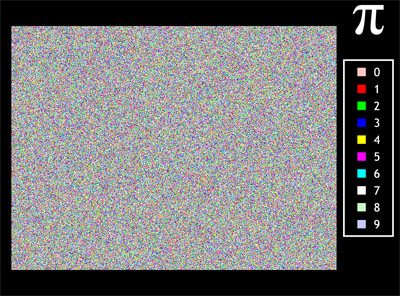
each of the 10 possible decimals of the number pi is displayed by a distinct colored pixel.
[link: ]
each of the 10 possible decimals of the number pi is displayed by a distinct colored pixel.
[link: ]
 Time and Date follows Time Zone (Brussels)
interesting :)
yay! your blog is alive again = )
geez, I'll do more of this ^_^
seeya
Radial one is ready now http://flickr.com/photos/peewack//
If I'm looking at a 'box' of digits, each colored according to it's decimal value, then when the box, which is delimited by a finite boundary, causes the sentence of digits to wrap to the next line, is it not changing the image we see?
If the box were widened by one pixel, the relative position of every single point is shifted in relation to the rest, altering the image, which would mean that any shapes or patterns that might be identifiable in one set, would be different in another. I like the idea of the radial one. How many constructions could we come up with?
abcdef
ghijkl
mnopqr
stuvwx
yx
vs.
abcdefg
hijklmn
opqrstu
vwxyz
Same dots, same order, different arbitrary arrangement, different possible patterns will emerge, or not.
Perhaps the color assigned to each number could be shifted to yield patterns that can't be seen when the numbers are simply assigned with zero = white, 5 = magenta, etc.
Maybe the color assignment could be linked to the distribution of the numbers in Pi. For example, set the digit that appears most often as black (like empty space) and the more unique digits as progressively brighter shades of gray or more vivid colors.
Perhaps the area (shape) of the field of dots we're looking at should match a mathematical function that uses Pi (ie, get them to fill a space bounded by a function of Pi). Seems that showing them in a box, is arbitrary, like trying to hear intelligent radio transmissions from space by listening to a narrow band of EM or RF energy, instead of the full spectrum.
What if we position the dots in a 3D shape, like a sphere? Maybe an image would appear similar to that of a Rapid Prototyping object being lazed out of a chunk of polymer.
Isn't pure research fun?
Is that a sailboat I see ? :P
no its a schooner. ;)
Anyone try the relax-your-eyes-and-stare-at-the-picture trick?
You know, like those pictures they used to sell in the 80's at the mall and you'd stare and relax your eyes and a sailboar would come out?
I believe that would be Great Cthulhu you're seeing. Don't stare too long!!
if staring at pi causes the downloading of yuggoths to the hypothalamus [P]Wack's in big big trouble! :)
Koji Kakinuma, Japanese calligrapher's work PI: http://www.kakinumakoji.com/image/05hankyu-mugen/ensyuritsu.html
This is pretty cool stuff, i wonder what would happen if there would be more of a imagage if instead of a rectangle shaped tv, a circle was constructed instead. After all Pi originated from Circles :)