
an impressive online sharing project, developed by the renown IBM , to encourage sharing & conversation around visualizations. the goal of "Many Eyes", which is still in 'alpha phase', is to "democratize visualization, enabling anyone on the Internet to publish powerful interactive visualizations & start their own data conversations."
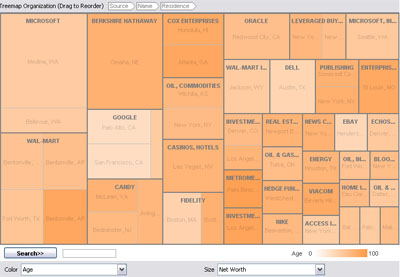
the website is set up to allow the any person to upload data, visualize it, & talk about the discoveries with other people. the datasets originate from the users. soon, people should be able to add their own visualization techniques to the website. static versions of individual visualizations can be added to blogs, as shown below.
at first sight, Many Eyes seem to contain more powerful & interactive data visualization techniques than Swivel, altough it lacks more sophisticated blogging features.
see also Gapminder/Google's large collection of free public data visualizations.
[link: & |thnkx Fernanda]
 Time and Date follows Time Zone (Brussels)
Very cool. However, "Discovery" seems to be limited to simply selecting items on a graph, or changing the axis.
I do not see a way to display multiple graphs at the same time, and see correlations between them (where multiple graphs share the same color coding, selection, etc.)
To perform this type of visualization and discovery, on your own data, without having to share it with the world, try AgileGraph.
AgileGraph uses the same formatting as the Many Eyes dataset format.
-Jeff Carpenter
www.agilegraph.com