
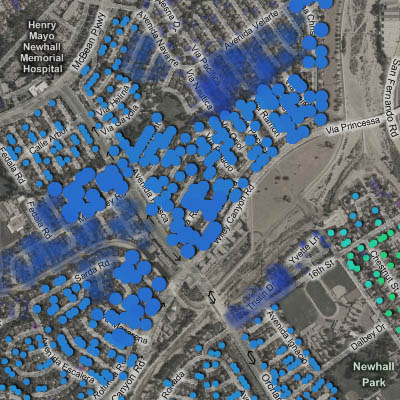
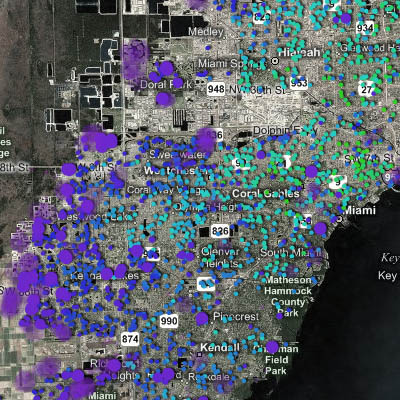
an animated & fully browsable map of all homes in the United States, based on the huge catalog of U.S. residential properties & their construction dates retrieved from . developed by the well-known , the dynamic animations use the year the properties were built to show the growth of streets, neighborhoods & cities over time.
it is quite impressive to explore how some sudden residential growths develop over time, ranging from the lineair, grid-like , the internal redevelopments caused by or the fast growing metropolitan areas around .
[links: & ]
 Time and Date follows Time Zone (Brussels)
There is an error in this article. It is not "grid-like Piano Tx", it's PLANO Tx. I should know, I live there.
Please correct this.
This is a really cool applications. From the classroom to the board room, this application can be used in a broad range of environments.
For those interested, be sure to check out a later post about Trulia Hindsight's usage here.