
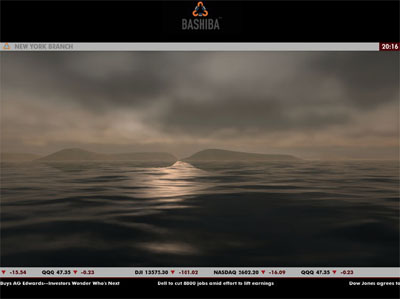
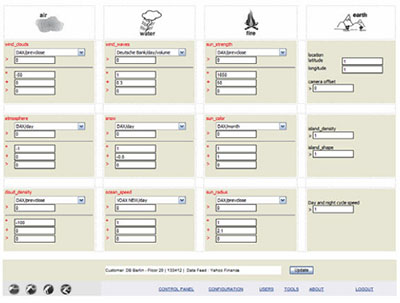
a commercially available ambient data panorama that dynamically reflects the overall "mood" of a rich information environment. the so-called "data atmosphere" reacts in real-time to multivariable changes (e.g. stock market data), that are then mapped to visual counterparts (e.g. ocean waves, sun strength, wind speed, rain). the resulting information display can be interpreted "without cognitive effort".
"once the stock market opens, our 3D simulation comes to life, & people start 'breathing' business information."
[link: |thnkx Ralph]
 Time and Date follows Time Zone (Brussels)
this sounds like something off Douglas Adams' "Dirk Gentley" (where the main character visualizes data using flocks of birds, music and landscapes...)
Very nice! The 3D rendered visualisation is a very nice approach. I've seen a few stock market data driven ambient computing devices in the past (glowing orb, dangling vibrating string), but none as detailed as this.
I think there is a danger of going too far with the vis though, if you have to concentrate on the display and analyse the scene, you're moving away from the ambient element where you don't even have to focus on the object, a peripheral glance will do.
This is a beautifully done ambient information display. But come on, applying for a patent?
Great post, Rob, it describes the panorama and underlying functionality very well!
sort of like the datafountain
http://www.koert.com/work/datafountain/