
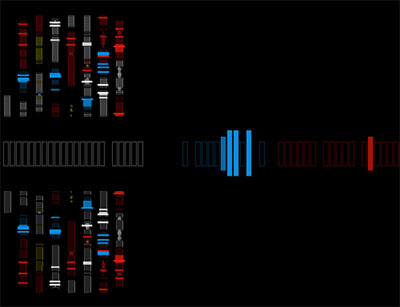
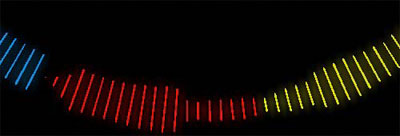
a real-time data visualization projected on a physical table that aims to augment the developing verbal dialog by displaying a representation of conversation to all people present. the visual graph on the table demonstrates turn-taking, domination, interruption & activity throughout a conversation.
the Conversation Clock uses tick marks along concentric rings. just like a clock, each ring contains a single minute of tick marks. the inner rings represent earlier times in the history of the conversation. each mark is colored according to the microphone from which input was received & sized to indicate the amplitude of the associated waveform. as a result, phenomena like activity & turn-taking become easy to observe, such as people not speaking versus dominating the conversation, or aspects such as interruption, silences, and argument also make visual impressions on the table.
[link: & (PDF, 471KB)|thnkx Andrea]
 Time and Date follows Time Zone (Brussels)
I wonder how this display of the conversation of people would look as a kind of 3D-Hologram.
Imagine visualizing, not only hearing, our language in the coming 3d-Cyberspace.
This invention could be one of the steps leading to this fascinating world of the future.
Yeah this looks pretty exciting. Being able to visualize verbal patterns could be useful for interviewing as well, amongst many other applications.