
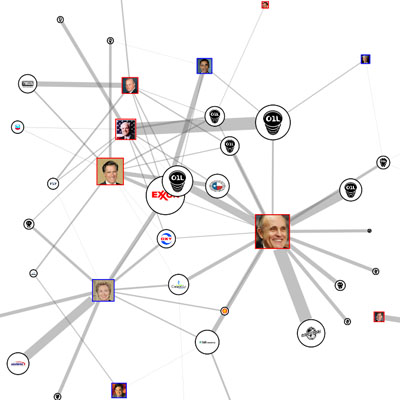
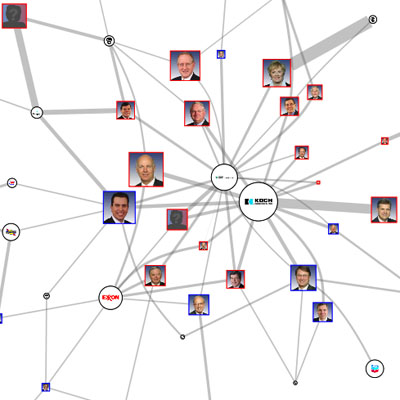
a network visualization of the funding relationships between oil companies & current US president candidates.
in the "relationship view", the more money a politician has accepted from the oil industry, the bigger their picture is on the map. the more money they have accepted from an individual company, the thicker the line will be that connects them. elected officials & companies are positioned by their relationships, those that are close together tend to have similar patterns of giving and receiving. in the "table view", politicians are ranked by their total dollar amount received, together with the companies that donated them.
[link: ]
 Time and Date follows Time Zone (Brussels)