
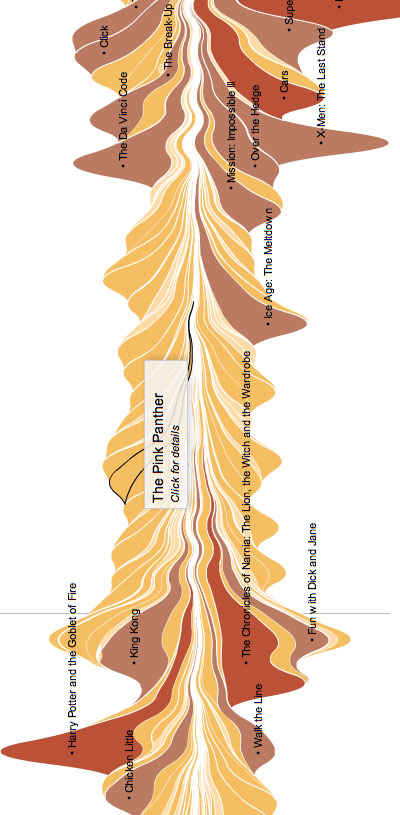
a compelling interactive data visualization of the box office receipts between 1986 & 2007. each shape corresponds to a single film. the height shows the weekly box office revenue, the width its longevity. color further highlights the success of a movie.
the specific visualization method is known as a ThemeRiver, originally published in 1999 (PDF). see also music listening history graph, email mountain & history flow.
[link: |via & |thnkx Wouter & everyone else who sent it in]
 Time and Date follows Time Zone (Brussels)
Downloading is ruining the Movie studios, you say?
Not according to this graph. It seems we're actually watching *more* movies in the theatre since the advent of downloading.
this didn't quite work for me. too much discontinuity in the flow. i did a quick and dirty to see if i could resolve some of what wasn't working for me. see what you think - http://www.robzand.com/blog/re-envisioning-the-ebb-and-flow-of-movies