
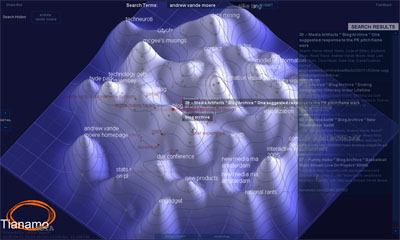
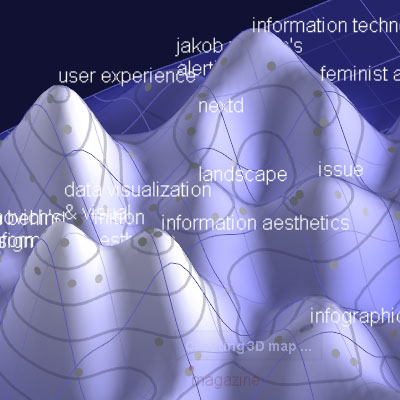
a browser-based 3D information visualization tool for interacting with high-dimensional structured (eg. stock tickers, etc.) & unstructured data (eg. web search results). the current beta shows how results,parsed from Yahoo search, are mapped as dots on a flat surface, with distance denoting similarity (by text analysis algorithms). the landscape morphs in a 3D landscape as common subtopics appear as mountains. the closer the mountains, the greater the similarity between the topics they represent.
a demonstration video after the break shows an implementation using Yahoo search results. the goal of this demo is to "get a read on people's reactions to the concept generally (& hopefully identify some key applications)". do you have a constructive critique or useful suggestions for the developers?
[link: ]
 Time and Date follows Time Zone (Brussels)
This looks like a full-3d version of the now-defunct NewsMaps(.com) application that demonstrated Cartia, Inc.'s ThemeScape product (also now defunct?) I think I preferred the original -- the classic map colors were just easier on the eye, and shading and contours gave me all the 3d information I needed without annoying rotation.
http://newsbreaks.infotoday.com/nbreader.asp?ArticleID=17968