
This very website does not really post about competitions a lot, let alone will it partner with one (though few exceptions exist). However, this competition is different, as it does not consist of a nice prize and then-be-done-with-it. In fact, it will actually pay $5,000 to one of three winners to collaborate with software and exhibition experts to help implement the visualization for a real-world museum installation.
This means this is the first 'commission-based' competition within the field of visualization, at least that I know of... In my humble opinion, this is how data visualization competitions should evolve: not only to pick a winner, but also to give that person the chance to get some real-world experience and exposure. Similar schemes seem to work fine in other design-related fields like architecture or fashion, so maybe it will also work for visualization?
So here is the official call. Note that a few more fine-print details are available below.
----
Museum software company is holding a data visualization competition on the subject of ... sexually-transmitted infections (STIs). Yes, gonorrhea, syphilis, chlamydia: we have got (data for) them all.
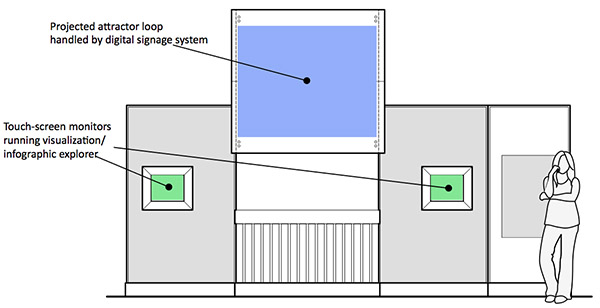
Some context is probably in order. The current is relocating to a brand new facility. This new science centre opens to the public in late October 2011. This means all exhibits are new, and not just in the shiny "fresh out of the box" way. The focus is very much on play and exploration - inquiry-based learning rather than the didactic fact panels of old. Within the Human Body gallery is the "STI exhibit", described as:
Gaining an epidemiological view on sexually transmitted infections makes them interesting in a different way. Visitors use a touch screen to explore a database of Calgary, Canadian and perhaps global STI data. The interface is clean, good-looking, easy-to-navigate and judgment-free. Visitors can browse the data by location, age, disease, age group and time. The results should be primarily visual (as opposed to numerical) and unfold (be temporal rather than static)."Rather than use an in-house graphic designer, EDM is holding this competition to (i) identify compelling ways of looking at STI data, and (ii) commission a visualization guru to see the exhibit through to completion.
Individual prizes of US $1,000 will be awarded to three of the best entries. One of these entrants will be awarded a US $5,000 commission to spend a further person-week working with the exhibit developer and the software folks at EDM in taking the design through to the final exhibit.
The contest closes on 22 August. If you are interesting in participating, please send an email to . By registering, you will gain access to the competition data (a subset of the actual data, part of which is available .
 Time and Date follows Time Zone (Brussels)
Can we see the winning entry here?