
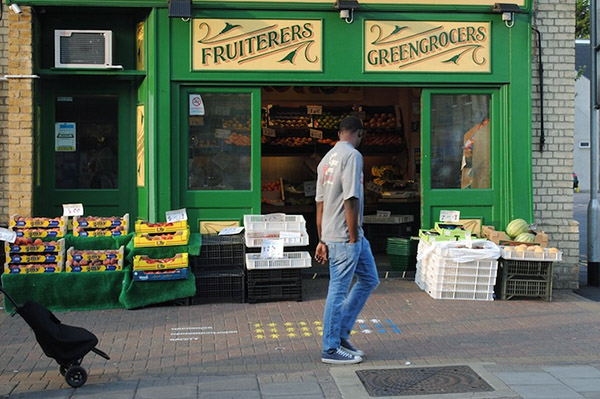
[visualisingmillroad.com] by Lisa Koeman, Vaiva Kalnikaite and Yvonne Rogers from was a community project that combined citizen participation and public data visualization to inform a community on what other members of that community think of specific local issues.
The subjective opinions from local inhabitants were gathered by voting devices that were installed within several local shops. The results from this survey were visualized on the pavement in front of the shops, with the help of local artists. As more questions were asked, the infographic visualization became a bit bigger every other day.
See also:
. "Infovis Graffiti: Spray Painting Infographics in the Wild"
. "Broadsides: Showing Infographics... in the Street"
. a recent of our own in the realm of "" (PDF).

 Time and Date follows Time Zone (Brussels)