
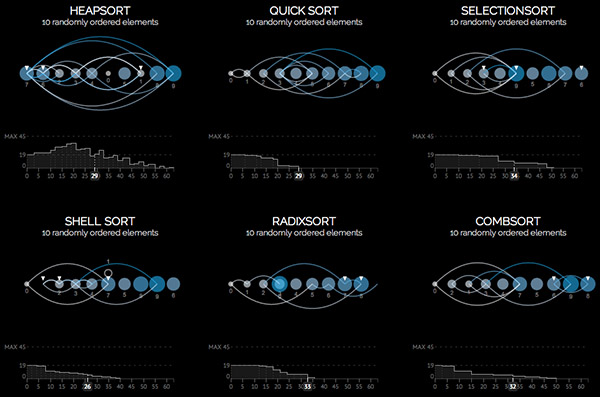
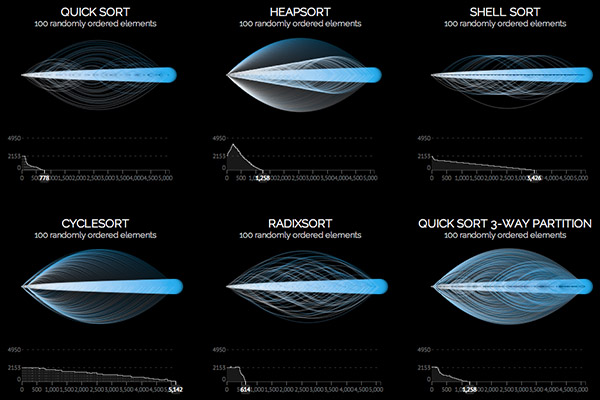
There are quite a few visualizations of sorting algorithms out there, such as at and . "" [sorting.at], developed by Nokia data visualization designer , brings some innovation to this field by tackling the issue educationally (explaining algorithm step by step) as well as artistically.
The project was initiated to create visual representations of sorting algorithms with the hope of discovering patterns in their visual footprints. It provides an interactive walk-through that guides the reader step after step along the process of ordering a lists of integer numbers for a selection of sorting algorithms.
 Time and Date follows Time Zone (Brussels)