
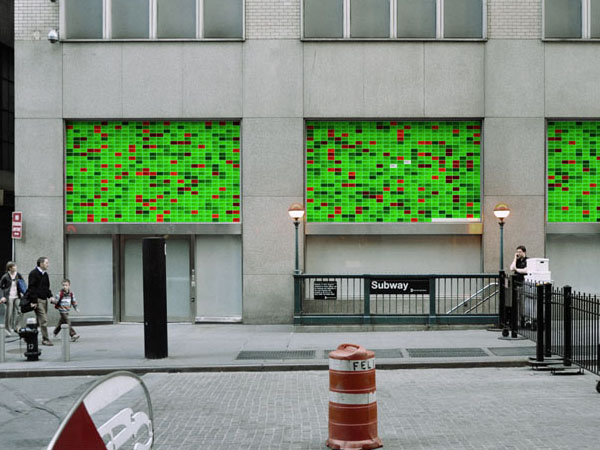
[stockmapper.com] (note: works only during U.S. markets are open...) is an online stock heat map, representing the performance of all common stocks listed on the NYSE Euronext. The heat map renders the individual percent changes in market value for more than 1,800 U.S. and non-U.S. stocks. Users can filter the stock quotes by logical groupings such as geographic region, industry and major indices. The map can also be sorted by ticker symbol, price change, volume or market capitalization. Upon selecting an individual stock group a "bridge bar chart" appears of the price change and trading volume of all stocks in the group.
Interestingly, StockMapper was originally designed as a non-interactive map of the market to be shown on a number of exterior data displays outside of the NYSE's Wall Street building.
See also STOC, NYTimes Financial Treemap, Vredit Crisis Visualized, SmartMoney Map and .
 Time and Date follows Time Zone (Brussels)
Stock market trading seems to be an important part of the world. But is it too important? It is very much run by two thought patterns, fear and greed. If we could invent a whole new machine to strength the growth of civilization -- one without having these attitudes -- what would it look like?
Stockmapper is okay but there is a better one at vizumetrics