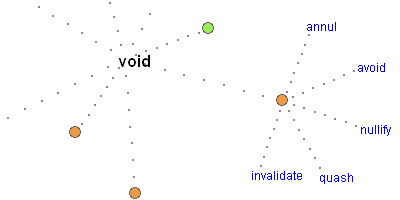
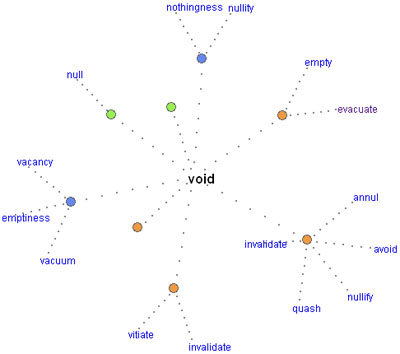
an online force-directed data visualization application of the , fully based on the Javascript programming language. this early prototype demonstrates how Javascript-driven force-directed graphs might be useable in web application user interfaces for search, document navigation, etc. "the display uses only the DOM (Document Object Model) with CSS (Cascading Style Sheets) for absolute positioning & ... being pretty."
see also color project & radial visual browser & google browser.
[ & ]
MORE
 Time and Date follows Time Zone (Brussels)
This is almost the same as Visual Thesaurus. I guess it's the source for inspiration.
Ever since I first saw Visual Thesaurus, I have longing for an mindmap-esque app built on this visualization technique. Thinkmap, the developers of VT, lets you use their vizualisation engine - starting from $500.
Maybe this javascript version will be an good open-source alternative.
yes daniel, the author indeed mentioned these examples, & his wish to make a free alternative!
Could you please post urls? Or hide them less?
daniel e says "...I have longing for an mindmap-esque app built on this visualization technique".
Topicscape (http://www.topicscape.com) does mind mapping in 3D, but more solid 3D - without the 'floating in the mist' feel of Thinkmap.