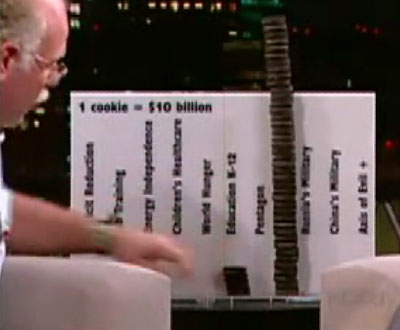
data visualization with food: a "live information visualization demonstration" using stacked cookies (Oreos) as bar charts to illustrate the distribution of the United States federal budget. a large collection of BB candy is used to demonstrate "how many weapons the United States have". 1 Oreon cookie represents 10 billion dollars. 1 BB represents the equivalent of 15 Hiroshima bombs.
see also San Francisco in jell-o & US tax infographic.
[ & & |via |thnkx Moiz]
MORE
 Time and Date follows Time Zone (Brussels)
papa, doe maar even kijken,
hij is heel sterk!
Groeten!
Cathy & Stephan