
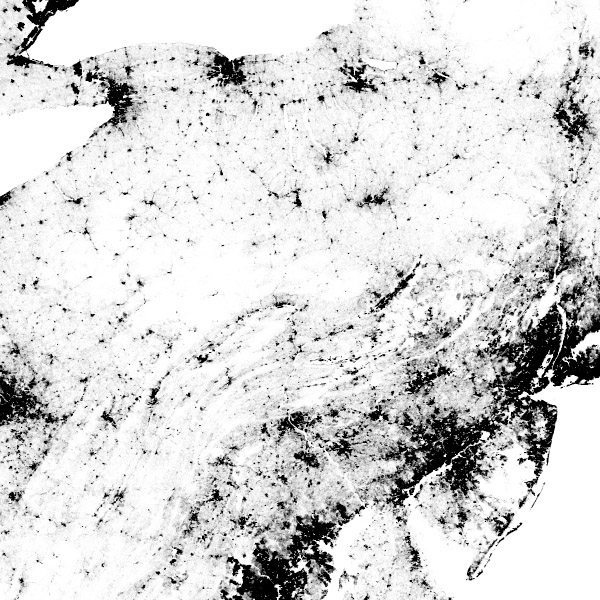
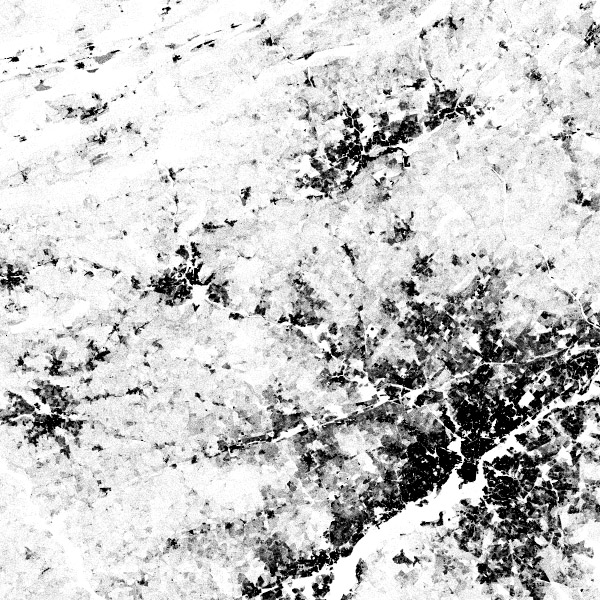
[bmander.com], developed by computational urban planner , maps every person counted by the 2010 US and 2011 Canadian censuses as a single dot. Consequently, the map contains about 341,817,095 dots - one for each person.
Technically, as the available census data is only available on a block level, all dots are placed randomly within each block's perimeter. More explanation about the development can be found .
 Time and Date follows Time Zone (Brussels)