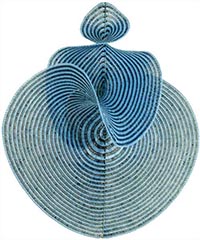
 a model made out of 25,511 crochet stitches to represent the Lorenz equations, describing the nature of chaotic systems. tangible beautiful numerical data. []
 Time and Date follows Time Zone (Brussels)
a model made out of 25,511 crochet stitches to represent the Lorenz equations, describing the nature of chaotic systems. tangible beautiful numerical data. []
Time and Date follows Time Zone (Brussels)