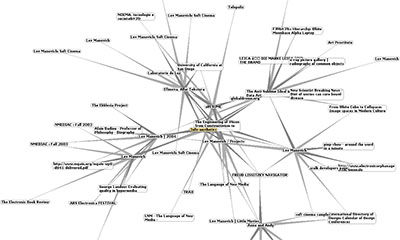
 an interactive network visualization of hyperlinked websites, mapping the content-based network characteristics of the internet. []
 Time and Date follows Time Zone (Brussels)
an interactive network visualization of hyperlinked websites, mapping the content-based network characteristics of the internet. []
Time and Date follows Time Zone (Brussels)