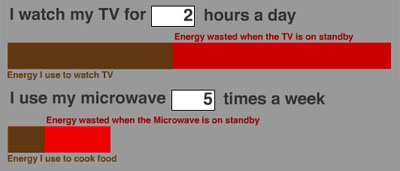
 minimalistic graph visualizations showing the amounts of electrity consumed by custom appliances when they are on 'standby' versus when they are actually used. for example, these graphs demonstrate that a normal microwave will consume more electricity just sitting there plugged-in than it will ever use to cook food. [|thnkx Haiyan]
 Time and Date follows Time Zone (Brussels)