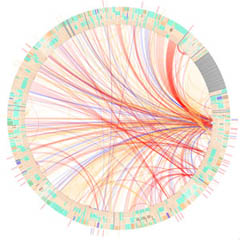
 a circular data visualization of the genetic interaction network of E. Coli, representing each gene with colored segments associated to the structural description of the gene’s main function. the color of the relation curves express the nature of relation, & the traces external to the circle establish a relation of auto regulation. the genome of the E. Coli contains approximately 4300 genes, which have around 8700 identified functions. the 'interaction network' involves 720 genes, with 1350 relations that describe the inhibition & expression of each of the genes. each relation in the network describes either: gene expression, gene inhibitionor dual state. this genetic visualization is currently shown at . the data mapping metaphor reminds me of schemaball. [ & & |via ]
 Time and Date follows Time Zone (Brussels)