
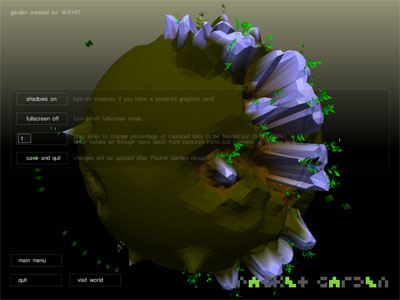
an aesthetic 3D visualization of daily Internet use, downloadable as a free software package. packet Garden tracks all the visited servers, their geographical location & the kinds of data that is accessed. uploads make hills & downloads valleys, their location determined by numbers taken from the Internet address. the size of each hill or valley is based on how much data is sent or received. plants are grown for each protocol detected by the software: website visits correspond to an 'HTTP plant', while eMule sharing generates a 'Peer to Peer plant' is grown, & so on.
see also organic html & texone.
[link: |thnkx Julian]
 Time and Date follows Time Zone (Brussels)
Very interesting... similar to Sparklines, this is also a great idea... BTW, where do we download it or try it online?