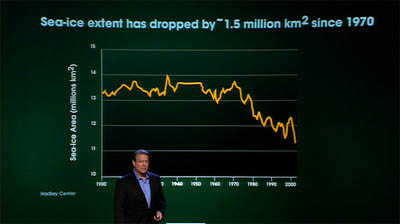
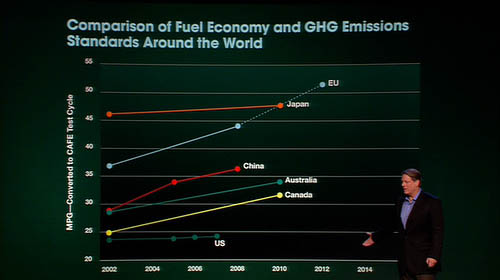
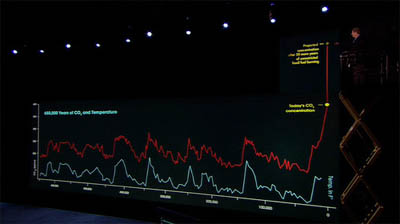
a collection of all the infographics illustrations that was used in the movie .
[link: |via ]
I wish that you would make these charts a bit larger so that I can actually read them.
I wish you would make these charts a bit larger so that I could actually read them.
Katie, please follow the flickr.com link in the original post.
would u wanna share these graphical data into large scale...
it really help me to finish my final papers...

 Time and Date follows Time Zone (Brussels)
I wish that you would make these charts a bit larger so that I can actually read them.
I wish you would make these charts a bit larger so that I could actually read them.
Katie, please follow the flickr.com link in the original post.
would u wanna share these graphical data into large scale...
it really help me to finish my final papers...