
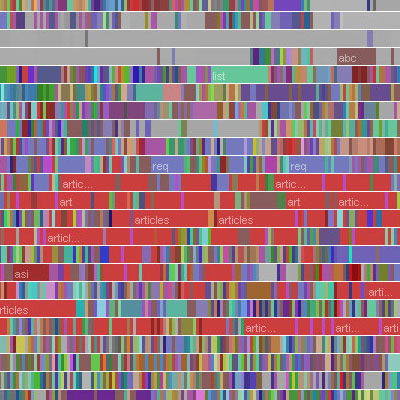
a data visualization technique that is able to represent long sequences of text. here chromograms are used to analyze the behavior of Wikipedia users, in order to find patterns in histories of tens of thousands of edits.
chromograms map text strings to color: the first 3 letters of a string determine the color of its representation. the 1st letter determines the hue, the 2nd letter the saturation, & the 3rd the brightness. although seemingly arbitrary, it actually reveals a series of important patterns in the editing activity of Wikipedians, such as so-called "systematic activities", or a sustained related sequence (e.g. alphabetical) of edits.
[link: |thnkx !]
see also history flow & wikipedia treemap.
 Time and Date follows Time Zone (Brussels)
Does this mean that someone could reverse the process by painting a series of blocks and generating a story from the result? Every picture tells a story?