
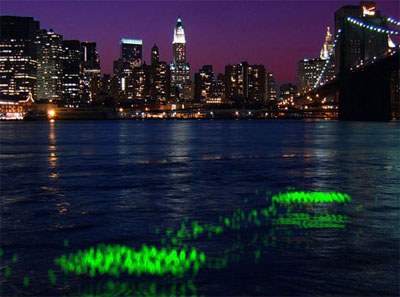
an ambient installation visualizing the actual water pollution by a colorful LED light system floating in a river. the light system measures the water quality using a network of re-wired pH sensors connected to light-emitting, thin film photovoltaics strips that glow red when the water quality is poor & green with the water quality is good, all powered by a single rechargable AA battery.
[link: & |via ]
see also public air quality monitor & pollution data driven colored smoke.
 Time and Date follows Time Zone (Brussels)
Very, very creative. Borderline brilliant. This is the kind of ambient data awareness I'd love to see more of. All too often, data visualization is either too much art (and not enough science/engineering), or too much science (and not enough art to want to view it). This is a fantastic balance between technical know-how, environmental consciousness, and ambient visualization. Major kudos to the designers.
I agree with Euphrosyne, brilliant.
Small inventions like these will raise awareness amongst people, and make it visible how we take care of our environmnet
It's just a ph meter. It's not going to be very useful in the real world of aquatics for the purposes they're going on about.
I agree. ph is not going to tell much, but to be helpful rather than uselessly critical...
TOC (Total Organic Carbon) would be a single sensor that could tell you about alot of different nutrient run off and even pesticides. I am an ecological designer who collaborates with artists. I'm currently working on a project in California visualizing water quality. and am happy to help others too.
Cheers,
Brent