
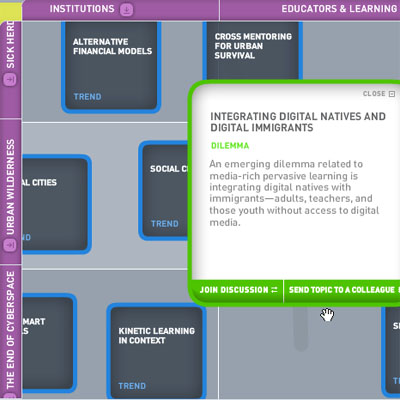
a graphical concept map that forecasts a consistent view of how future forces will affect the components of public education in the US. the map was created by aggregating the opinions of relevant experts who create intensive case studies based on field research.
the vertical side shows 6 categories driving all trends, such as "smart networking", "strong opinions" or "the end of cyberspace". the horizontal direction illustrates 5 key areas of activity where major trends are revealed, such as "family", "institutions", or "educators". different rectangular zones depict the dilemmas, trends or hotspots that will impact public education.
[link: ]
 Time and Date follows Time Zone (Brussels)
Great resouces - great find! thank you !!