
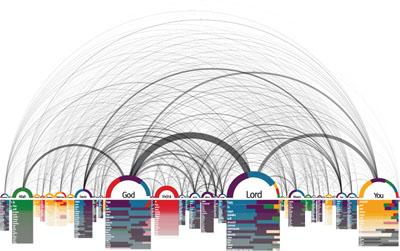
a large-scale data visualization of the textual analysis of English translations of the Holy Scriptures, illustrating the relationships between Christianity, Islam, Hinduism, Buddhism & Judaism.
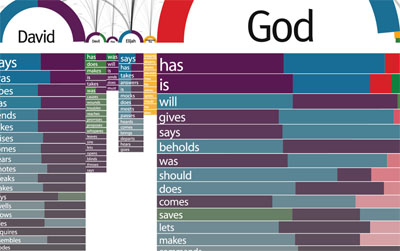
in Similar Diversity, all characters are aligned alphabetically on the x-axis. their name & arc size is calculated from their total word count in all scriptures. the colored arc segments show the frequency of the word or the character in the particular Holy Books. bar charts below the names break down the activities of the characters in detail. the arcs connecting the names symbolize similarities of the activities assigned to a character pair.
[link: |thnkx philipp]
 Time and Date follows Time Zone (Brussels)
Great find. It reminds me of Anh Dang's ITP project "Gospel Spectrum" (http://portal.acm.org/citation.cfm?id= ) and more recently Linda Becker's CSM project "In Translation" (http://www.macd2007.com/author.asp?ID_Cont=46 ). The whole area of abstract visualizations of books seems to be growing, and the bible seems to be a good testbed for these projects.
yes, Gospel Spectrum comes very close, & also bible exegesis.
how long should we wait before someone visualizes the whole Harry Potter story?
This day will soon come here again.
I love this project.
Visually abstracting texts, as well showing the relationships between different sources, seems to be the way to represent information in the future.
It specially lends itself to the analysis of content with a high density of information, as it seems it would be easier to roughly grasp over which topics, and in what proportion, the content is spread. I wish google came with a feature like this...
long time reader! love your blog, on the forefront of aesthetics & tech all the time. loved this project a lot, great visualization idea.