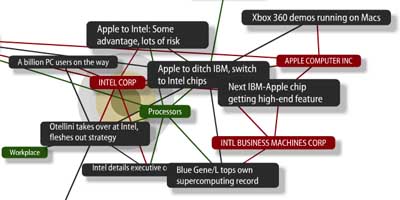
 the new 'beta' version of now features an interactive ontology viewer that 'connects the dots between stories, companies, & topics within the news.com site'. this network diagram shows relevant links to other stories & highlights the important companies that appear in the story as well as attaches appropriate topics to each story. in addition, a 'what's hot' button displays the 15 newest (color brightness) & most read (size) stories in a treemap diagram.
this seems to be the first time such interactive data visualizations are prominently featured on a high-profile website. see also music plasma (the company delivering these visualizations). [|via ]
 Time and Date follows Time Zone (Brussels)