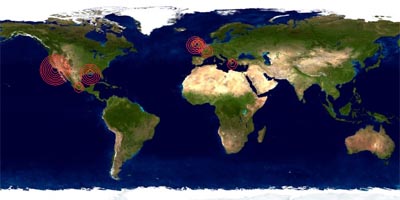
 a world map showing the current hotspots of news in real time. users can hover over the newsquake circles & preview the most popular news headlines related to specific geographical locations. as this project is already three years old, it seems to be the predecessor of more recent dynamic data visualizations that display the geographical locations of world news headlines in real time, including buzztracker, vanishing point & akamai net usage. []
 Time and Date follows Time Zone (Brussels)
seems to display the region of the story's source, not the subject...