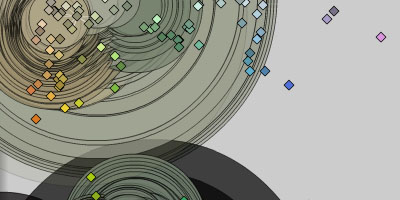
an interactive visualization showing the characteristic color distributions from several artworks. users can choose specific painters & compare similar artworks for further exploration. all pixels are traced for their color values, & the large resulting color palette is reduced by a large set of mathematical formula, resulting in dots mapped on a 2D color spectrum & circles that represent the frequency, tendency & standard deviation detected within the color palettes.
the goal of this application is to automatically reduce color palettes from million of colors down to manageable hundreds of colors dominantly used in famous artworks, & to compare any interrelationships. [|via ]
 Time and Date follows Time Zone (Brussels)
thank you for helping to get the word out about In The Mod. it's a bit tricky to describe, but i really like your approach. the only thing that i would add is that the palettes are downloadable in formats that are compatible with flash, processing and after effects. i am really interested in closing the feedback loop, so i would love to see what people create with the palettes - showcasing these new creations will be a feature i add soon to the site.
thanks + woohoo!
drew