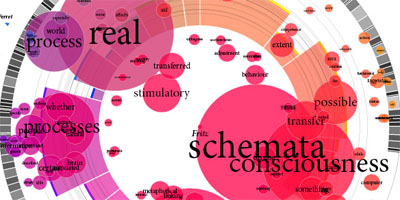
a beautiful, "visually intuitive" data visualization, which represents different characteristics of multiple essays published within a book.
the concentric circles represent individual essays, with the radius in proportion to the essay’s character count. the essays are depicted as pie slices that have been color-coded according to a predetermined color circle. the radius of the white space in the middle of the pie slices is relative to the length of the other essays. the central angle & transparency of each bar in the barcode-like structure that appears within the concentric circle correspond to the length of the essay’s paragraphs. word circles appear in the foreground represent a selection of the most frequently used words in the essay. a word's frequency is proportional to both its type size & the diameter of its circle, while the word circles' color is the basic color assigned to the author according to the color circle & the essay's position in the book. see also bible exegesis & gospel spectrum.
[]
 Time and Date follows Time Zone (Brussels)