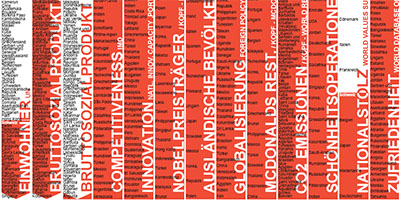
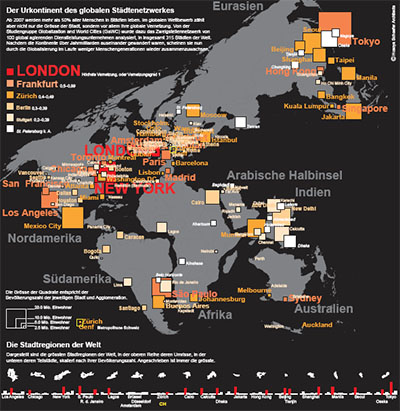
a large collection of beautiful maps based on data related to Switzerland & printed on large 2mx2m panels. these infographics are part of an attempt to find new ways to describe the identity of Switzerland ranging from the scientific to the artistic. "visualizations can help to propose new ways of thinking. they can help to see oneself not only in the historically grown context but also in the flux of globalization. the graphic language of the maps, based on the density of information used in an atlas, is meant to go beyond the straightforward transfer of information & to evoke associations & open up space for fantasy".
more Swiss infographics maps after the break. see also swiss virtual IPO.
[ & (pdf)|via ]
MORE
[all maps are created by Studio HosoyaSchaefer (http://www.hosoyaschaefer.com), printed by Weltwoche, Nr.52/53.04 (http://www.weltwoche.ch)]
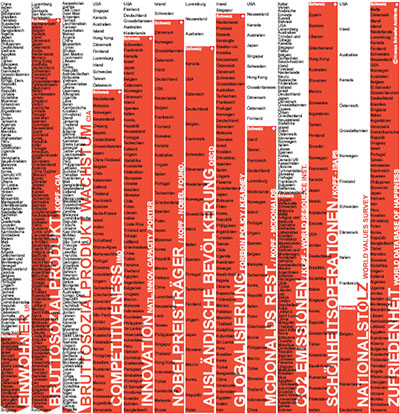
[source: CIA Worldfactbook 2003, International Society of Aesthetic Plastic Surgery (ISAPS), McDonalds, Novel Foundation, OECD, Porter M.E., World Database of Happiness, World Resources Institute, World Values Survey, Foreign Policy/Kearney, IMD]
[source: IMES, BfS, Batu F., Durrenmatt R, Wottreng W, www.lex.hist.ch, www.nationmaster.com, switzerland.isyours.com, www.augenauf.ch]
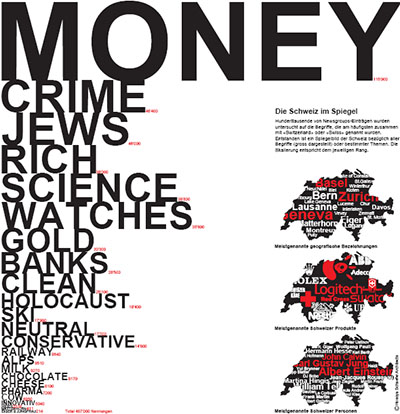
[source: NetBreeze, Leo Keller]
 Time and Date follows Time Zone (Brussels)