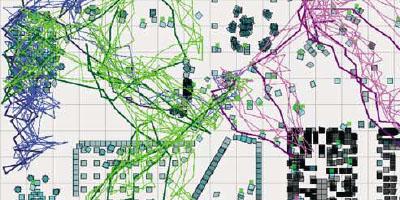
a visualization tool set that represents the evolution of 3D virtual environments, the distribution of their virtual inhabitants over time & space, & the formation or diffusion of user groups inside them. the visualizations are particularly valuable for analyzing events that are spread out in time or space, or events that involve a very large number of participants.
a chat log bar graph provides an overview about how many citizens & visitors participated in an event. a spatial distribution visualization traces & aggregates trails of groups on an automatically generated 2D map.
see also pedestrian levitation & mobile phone trace map & micro-fashion network.
[(pdf)]
MORE
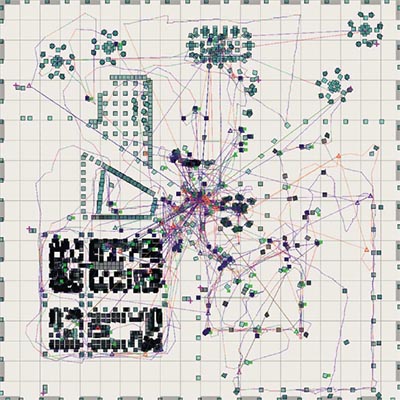
illustrations from Katy Börner, Shashikant Penumarthy, Social diffusion patterns in three-dimensional virtual worlds, Information Visualization (2003) 2, pp.182-198.
 Time and Date follows Time Zone (Brussels)
Interesting. I wonder how this compares with the data coming out of the PARC group studying WoW.
thnkx for the tip. I am trying to prepare a post about WoW. any additional information is welcome.
The PlayOn blog is the PARC/WoW data blog. Nick Yee occasionally posts about their findings over on Terra Nova.
http://blogs.parc.com/playon/
http://terranova.blogs.com/terra_nova/