
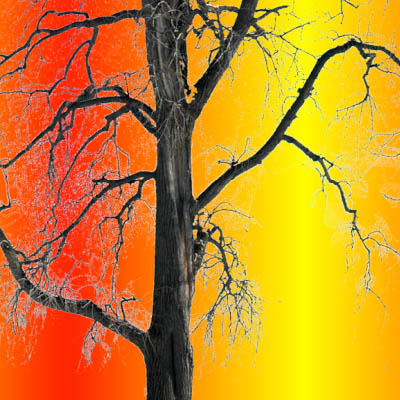
a data visualization artwork based on data from a building monitoring system that gathers electricity, condensate, & chilled water usage figures in real time. the purpose of the eco-visualization is to make key environmental performance data publicly accessible & easy to understand for everyone.
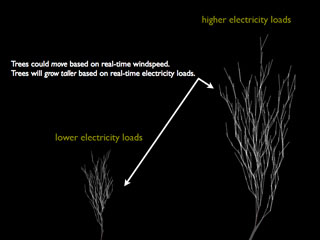
the so-called eco-visualization is composed of a sequence of animated clips using a series of tree images that correspond to the carbon loads in the building. an accompanying website invites building residents to make individual public commitments to reduce their own carbon footprint.
see also patterns of energy use & power-aware cord & standby visualization & power socket bar chart & wattson energy display.
[links: (PDF) & & (eco-visualization blog)|thnkx Sheryl!]
 Time and Date follows Time Zone (Brussels)
you suck. this didn't help at all.
CRACKERS,