
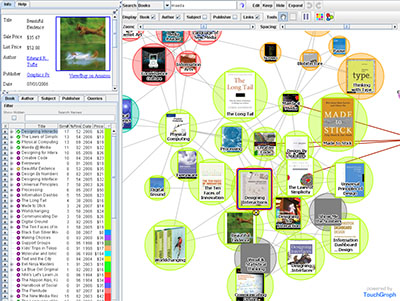
an interactive network visualization that aims to reveal the intricate network structure within purchase pattern recommendations. users can explore related books or albums, see how similar items form clusters around common subjects, & discover how the clusters themselves are connected within the information space.
it seems the visual information design & interactive features have been dramatically enhanced since their first google browser version about 2 years ago.
[link: ]
 Time and Date follows Time Zone (Brussels)
are there tools for designers to create their own visualisations describing data and relationships? I am not familiar with information graphics but I am looking for a software that might be able to map out adjacencies and proportions of the spaces of a building's program during the design phase....is there anything out there like this?