
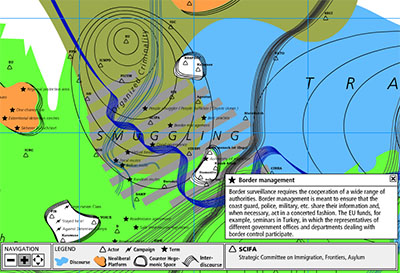
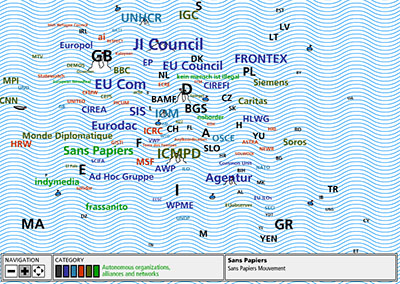
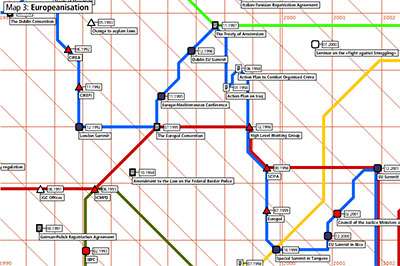
a rich collection of virtual maps illustrating current European migration policies. in particular, MigMap conveys a picture of how & where the production of knowledge is taking place in the area of migration, who is participating in & has access to it. it looks, for example, at how European standards in politics & civil society are implemented, & at the authorities, persons & institutions taking part in this process.
the 4 different maps, titled “Key Players”, “Discourses”, “Europeanisation” & “Places + Practices” provide access to a broad range of information on players, debates, processes & events that together comprise Europe’s present day migration policies.
[link: |thnkx Jack]
 Time and Date follows Time Zone (Brussels)
I've only been studying information visualization for a relatively short while...but these maps seem to obfuscate data rather than help it.