
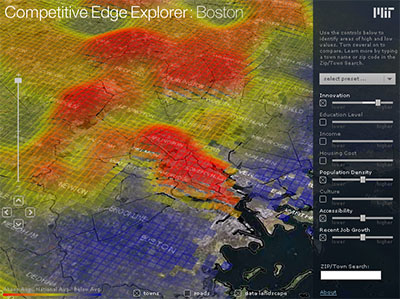
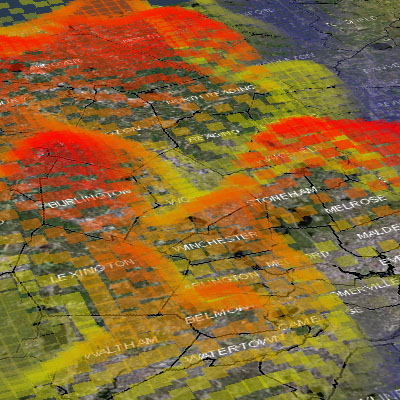
a 3D map-like visualization of the particular factors that help make Boston competitive in the global marketplace, such as innovation, education, income, culture or housing cost.
the "competitive edge explorer" visualization tool allows people to interactively compare the geographical distribution of abstract concepts such as culture, quality of life & innovation, explore where is job growth is occuring, or check the areas where income is high & housing cost is low.
[link: |thnkx ]
 Time and Date follows Time Zone (Brussels)
This almost looks like some graphics from Sim City.
That was one of the inspirations! ;-)