
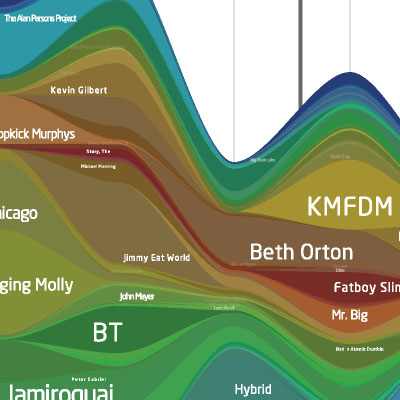
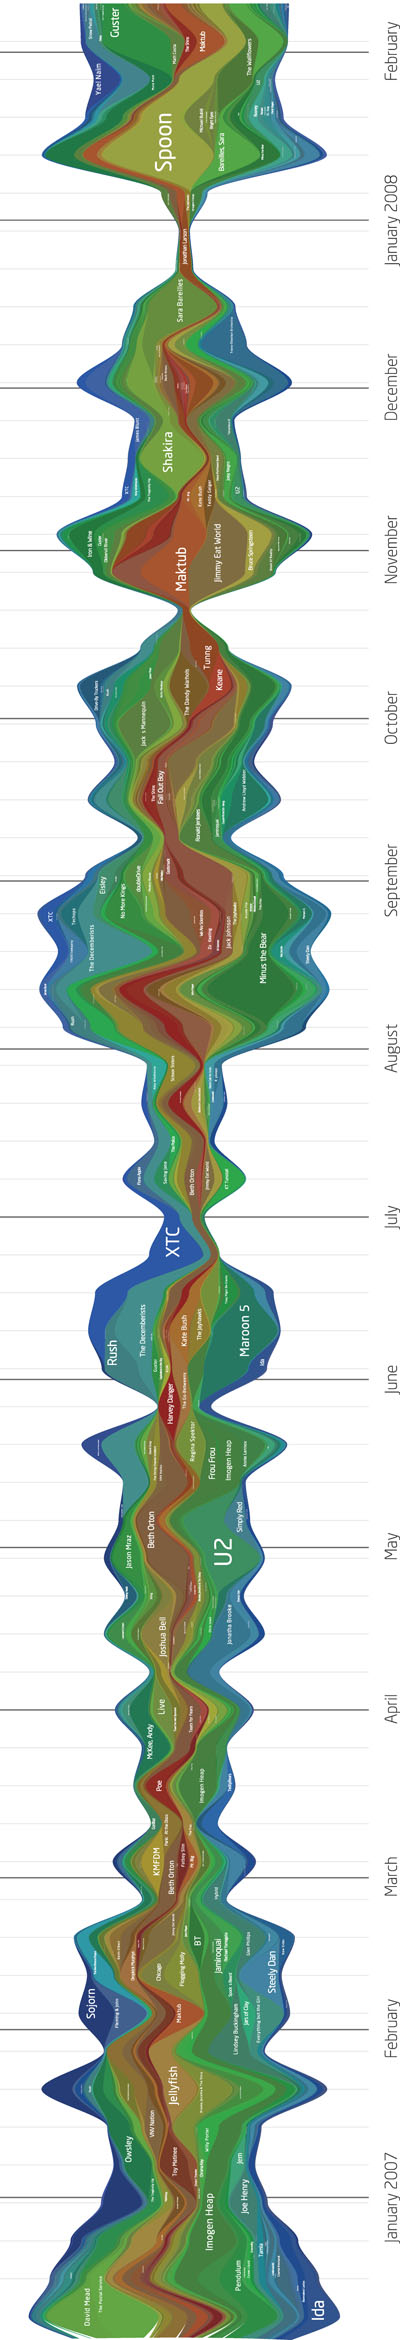
2 recent new reincarnations of the previously blogged WaveGraphs application, which uses the (PDF) visualization metaphor to convey one's historical music listening habits on last.fm. the color indicates the 1st time the artist was listened to, warmer colors being more recent. as a new artist is listened to it is put onto the outsides of the graph.
LastGraph uses data from Last.fm to generate high-resolution images of wavegraphs of one's music listening history as an online web service.
Extra Stats has a similar aim, but functions as a standalone Windows-only program that calculates statistical information using people's music listening history.
[link: (lastgraph) & (extra stats) & ]
 Time and Date follows Time Zone (Brussels)