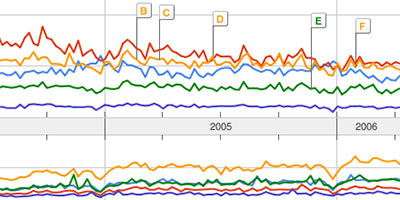
a set of simple line & bar graphs that enable users to compare the world's interest in up to 5 different topics. the visualizations depict how often these topics have been searched for on Google over time, how frequently they have appeared in Google News stories & which geographic regions have searched for them most often.
see also google finance & google zeitgeist.
[]
 Time and Date follows Time Zone (Brussels)
It reminds me of http://www.trendio.com a stock exchange on headline news where people can see trends in media and buy buzz-words.
Kinda useless as a tool...or anything else. I'm glad a little glad the market punished their stock for wasting their time and energy on something so utterly useless. (Please note this is the first time google has really disapointed me on one of their products.)
...would disagree with my abbreviated namesake. Would be good to target traditional media outlets of a specific region based upon one's product keyword.