
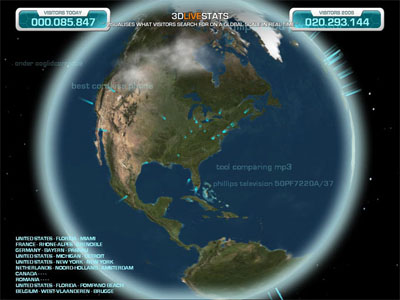
a new application that allows the visualization of any sort of data (e.g. website usage or offline data from external sources) on a 3D globe. this visualization can be shown on websites, or displayed onto large screen in a lobby, waiting room, conference room or CEO's room.
see also 3D data world globe & 3D world blogosphere viz.
[link: |thnkx Sanvito]
 Time and Date follows Time Zone (Brussels)
It's probably both the most attractive and least usable visualization I've seen in a while.
Spot on Zepher
Maybe Zepher. But want to start a free service for everyone. Take a look at: http://www.3dgeostats.com
Best regards,
Paul