
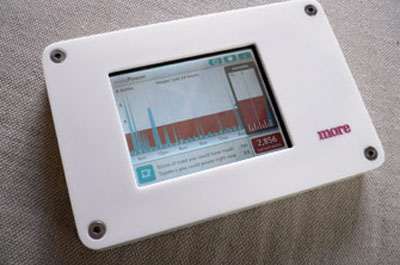
data visualization for the masses: a new real-time monitor that will help cut greenhouse gas emissions & the amount of energy wasted by appliances being left on standby is now proposed to be freely distributed in UK households.
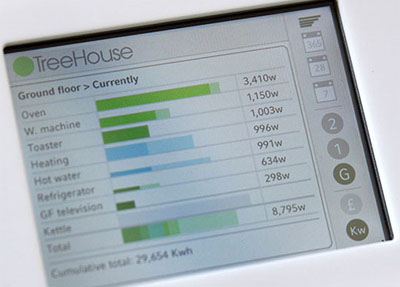
the MorePower device aims to give people more information about their energy consumption by displaying the cost of energy & carbon emissions over time & for each device. "the visual language is designed to let non-expert users quickly & easily understand the messy world of energy-use without becoming boring energy geeks."
will people be truly able to make sense of them?
see also eco-visualization & patterns of energy use & power-aware cord & standby visualization & power socket bar chart & wattson energy display.
[link: & & |via ]
 Time and Date follows Time Zone (Brussels)
Cool, who makes them and where do I get mine?!
Seriously though I think this is a good idea especially if it shows up in monetary value, people are more likely to pay attention to money they are loosing rather than the size of their emissions.
Would love to it be open source! With documentation, installation guide and parts & tools list. So everyone can go more green.
how much is the average spending for this type of electronic device
No hardware like this is needed to achieve what is proposed here! Look at th free energy monitor that is already available in the netherlands for more than 2 years now http://econote.nibfo.eu/
I WANY TO VIEW THE POWER USED BY PLUGED IN APPLIANCE