
For those short-attention readers between you, there is a book give-away at the end of this post.
The book has already been announced a few weeks ago, in a post which also included an interview with one of its editors.
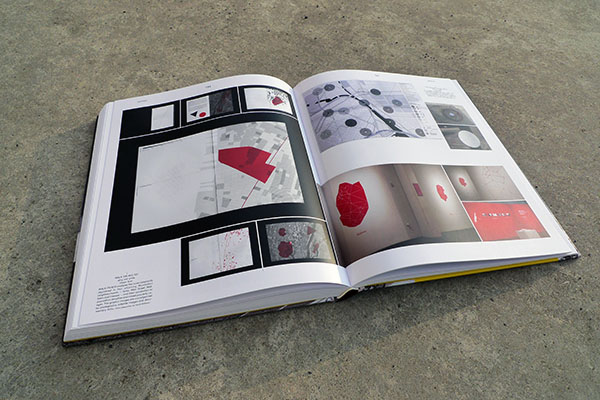
Being true to the number '2' in its title, the book shares many characteristics with its , such as the relatively out-of-the-box chapter titles (think 'datacurves', 'datablocks', 'dataesthetic'), an open, photo-rich layout, and a (quite contrasting) thick serif font face for the main articles and interviews. The book also features some strange editorial decisions I personally cannot wrap my mind around. For instance, in the first book, I was convinced the cover page featured a series of holes. Little did I know those black dots were actually (scatterplot) balloons. In the current edition, it is a spectactular mountain range that should grab the attention of the casual book shop customer, of which the silhouette forms a trend line identical to historical stock market trends. While being truly spectacular renderings, it would not surprise me that potential buyers would consider this book more to deal about alpine hiking rather than the designerly notion of information visualization.
The book then starts off maybe on the wrong foot, as its foreword is courageous enough to quote as claiming "The purpose of visualization is insight, not pictures". The article then finishes with the quote "Information visualization is too powerful and important to be left only to designers". While these are absolutely valuable viewpoints, this book in particular might not the best evidence of these claims, as it would be easy enough to open the book to a random page and blindly point to an example that proofs the contrary. Unfortunately, it might be this sort of reckless rhetoric, and in particular in combination with what the book actually stands for, that ultimately blurs the perceptions of readers and makes people like cringe.
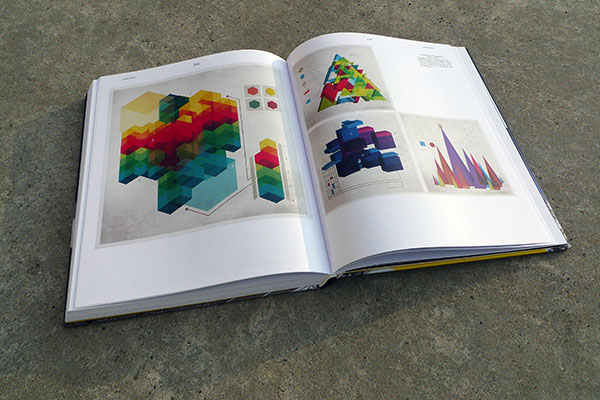
So no, many projects featured in this book are not examples of data visualizations that are both incredibly beautiful *and* deeply insightful. However, I would claim that despite those strong statements in the foreword section, it was never intended to do so. Instead, the range of creativity is immense, which is demonstrated by the range of presentation media: screen interfaces, sculptures, installations, clothing, cutlery, books, posters, tabletops, wallpapers, flags, projections, jewelry, ... You name it, anything that clearly demonstrates a superb design quality and is a representation of abstract data has been featured in this book (similar to this very blog?).
With its abundance of visually attractive and high-resolution depictions that literally jump of the page, the book is a joy to explore. Alternatively, you can have it just laying around for those moments of when your information addiction pushes you to once again get high on seductive ways of data expression. The physical format lends itself to casual browsing, while the short descriptions provide a glimpse into some of the insights offered. Additional content includes interviews with New York Times Graphics Editor Steve Duenes, Art+Com Director (think projects like this or this), and myself. It is up to the reader to just be visually stimulated or to literally dive into the visualizations and figure out the knowledge buried inside. At first, readers should be able to experience how beauty has at least the power to increase the human curiousness in discovering the meaning behind data, and the principles that drive it. And then finally, after some time, one might actually discover those valuable insights that Shneiderman mentioned before.
In short, Data Flow 2 is more than 270 pages of data-goodness for those who wish this very blog also came in a paper format. It will be truly appreciated by those who realize that reaching the ideal for both beauty *and* function is not a particularly easy goal, and much more creative exploration is still required.
By courtesy of the book's publisher Gestalten, infosthetics is happy to announce it will give away 3 (three) books. Just add a comment below proposing an alternative title for a potential third book, which is more original than "Data Flow 3". Entries close on Friday 26th March.

 Time and Date follows Time Zone (Brussels)
For part 3, I would like to propose the title "Information + Design = 3"
(Although the obvious answer would be "Information Aesthetics"...)
Enthusiastic & broke recent graduate drooling over this hardbound beauty...
I propose: "Semantic Visions"
How about "Sensual Data" for part 3?
well i would go for "data candy". although as mentioned before, "information aesthetics" would be the obvious self- speaking choice.
How about "Info to Insight"
alternative title for a potential third book:
- The Retinal Impact of Information Design
- Information Design is all Around Us
- From Data Flow to Information in Graphic Design
How about keeping the data flow part of the title (for continuity and SEO) albeit make it much more subdued eg only on the spine, in book title on amazon etc.
As for the cover, have many different visual representations of 3. That's where you can show your creativity and also engage the intelligent reader. Some of the visualisations will need to be obvious, but some could be more cryptic eg third month, third day of week etc.
If you want to go further you could launch a contest with the book to find all the threes.
How About "More into Data Illustration"?
I'd say "flowing with data - part 3"
GRAPHIC CONTENT
- or -
The Meaning of Design - Design of Meaning
- or -
Proper Form in Information
How about
Data Flow 3: A Thousand Words
because that's what a picture is worth, eh?
I've included Data Flow 3, because otherwise, it wouldn't vibe with 1 and 2, right?
My suggestion:
Data Aesthetics:
Simplify Complexity
I follow Fs' thought here. "Data Flow" already is a strong and well known name - if you change that, it is no follow up anymore.
You could add a sub-title, which could single out the specific contents of third book.
But anyways : If so, I would go with "Envisioning Data".
How about 'Data+Beauty'?
use a hashtag somehow #datavis
I'm for some dyslexia: 3 flow data
perhaps "Here There Be Data"
"From Data Flow to Data Flood"
"Information Stream"
"Even More Data Flow"
I suppose one could build on the brand much the way movie sequels and remakes do. Say, Data Flows, or Data Flowing, Data Flowers. Or just reissue a completely reimagined Data Flow without reference to the first. Or use an article, The Data Flow.
Elegant Data for Information Flow
"insightful information inclined"
or
"data^3" ['data' cubed - the '3' is superscript]
or
"data flow data flow data flow" in an endless loop (data flow three times, of course)
or
"data displaying insights" / "data display insight"
I like the title "Data Flow" and the readers are used to it. Maybe the subtitle could be shorter like: "Data Flow 3: Visualizing Information" or "Data Flow 3: Insight into visualization".
"Data Flow 3: Visualizing Information Thrice-great"
"The Book Of Infographical Revelations" or simply "Infographical Revelation"
"Data Flow 3: Visualizing aproaches in different media"
Data Flow 2011, etc.
"Here be data" is marvellous as subtitle. (+1 for Rich)
"Data Flows: Information Design Grows"
Metrical Ebb and Weave
- Data made visual
- Data visualization is worth a thousand images.
And The Data Keeps Flowing - vol III
Data Flood
Harnessing the Power (Data Flow 3)
Data Flux
Making Sense of Change (Data Flow 3)
Or if you're feeling particularly whimsical...
Data Flow III: Revenge of the Visualization
To be followed by:
Data Flow IV: A New Slope
Interpreting Data Visualizations
Data Flow V: The Pie Chart Strikes Back
Bad visualizations and the people that make them
Data Flow VI: Return of the UI
Perfecting interaction and data visualization
Data Flow³ - Infosthetics
Designing Information Architecture
Data Flow 3: Revenge of the Visualization
As others have stated, the brand of "Data Flow" has already been established. A complete change wouldn't be beneficial.
Databilia
(crasis of data+memorabilia)
InfoVisual
Too Much Information
NOW! That's What I Call Data Flow
Data: Flowever Young
Inflowmatico
Take your little Excel bar graph and get the hell out of my
data visualisation book
'Making Information Beautiful'
«dada flow»
Visualizing Data (whoops Oreilly has it)
so
Data Visualized or Data Visualization
Visionary Data: Data Flow 3.
Visionary Data: Data Flow 3.
Bringing Beauty Into Information
information / visual continuity
The Data Flow Continuum
Representations, Depictions, & Seductive Expressions
and on Facebook
didn't see the submit
The Data Flow Continuum
Representations, Depictions, & Seductive Expressions
It's the 23rd here in the States not seeing it or moderator approval
Data Flow 3: Total Domination
Visionary Data: Data Flow 3.
Data Flow 3: Mastering the Art of Data.
(Compliments to Julia Childs.)
Data Flow 2.999
data data data flow flow flow
Data → Design
This is fantastic! thanks for the announcement!
and my recommendation...
"When Data and Design collides"
cheers,
@RolandoPeralta
Rivers of Data
Data Flow 3: Charting's New Frontier
Data Flow 3: Charting's New Frontier
Awesome...Very Excited....for a third book I propose
Data Design
Data Stream
"One Look"
The URL to Amazon seems to not be working with Chrome for me. "That's not much of a title", you say? Alright, how about: "Data Flow - Understanding".
How about "Running the course of information"
Emergent Beauty
(the art of information visualisation)
adventures in data readability
The Art of Counting
QuantSee
DatArt
How about:
Experiencing Data: Visualization for Insight.
In Data We Trust.
The Design of Insight
Telling images.
or
data pornfographics. You will understand it when you see it.
Pornfographics. Making data explicit.
Data Flow 3. But spell the letters in blocks of High Density Bar Code that link to a website that??? Perhaps gives the reader more information which didnt fit in the book because of all the graphics. Maybe specific histories of the graphic forms contained. Or maybe have the title contain all of the information in the book, the text at least in barcode form.
See:Through.Data
or the more playful title for the 3-book set:
Design Does Data:
Making Data Your (Pretty) B*tch in 3 Easy Books
"Data-Flow-Tricolon"
Data Flow 3 Redux
"Data Flux"
Drowning in Data: Making Information Accessible
"Noticing"
Three Rivers of Data: Data Flow 3
Data Flow: Streaming Visualizations
Information design: escape from data deluge
or
Information visualization: escape from data deluge
Trifectaed
I second the vote for Data Candy.
Data Flux: Visualizing Information
Data Flow
ah the form took out my less than sign!
so lets try this....
Data Flow <3
Data Flow 3: Turn on the data hose
Mine:
Data Flow XYZ
I also like Jochen's 'Data Flow³'.
Data Flow³
is obviously the only choice.
Data Flaws
Data Whoa
Inflowmatics
Datascapes
Infoscapes
Data Insights
1 + 2 = 3, too
Data Flow 3: The Deluge
or make it french: le déluge
Dynamic data / data dynamics
Data Flowbee!
Data Lure
Vibrant Visualization
Data Pieces Without Pies
Insights Pried from Data
Data Flow 3: From Visualization to Insight
Data Flow 3: Beyond Visual Dimensions
For a blooper book:
Data Flow: Weak Stream
The Mac Data.
Data in Yo' Face,
Data Flow 3. Info a go go.
Data Flow 3: Sailing the seas of information on a Datamaran.
Data Flow 3: Dottin' N Plottin'
Data Flow 3: Yes We Can (this might be copyrighted)
Data Flow 3: I want free books.
but seriously...
Data Flow 3: Form and Figures
Data Flow 3:Visual Information Design
Data Flow 3: Data-o-matic.
I Am Abacus: Back to the Basics.
Data Flow This.
Data Flow 3: Form Follows Data (perhaps?)
Data Flow 3: A Tale of Two Variables
Data Flow 3: Cubed
Information is Beautiful
data flow cubed
infoflow
data circus
it would be nice if german publishers use german title for their books.
so lets call it "Datenstrom 3" or "Datenstrom DREI"
sounds really nice. maybe for english speaking people too.
bye
Data Data Data, it flows still
"Statistical thinking will one day be as necessary for efficient citizenship as the ability to read and write" said George Wells.
So in the Data War, I think "Data Flow 3: The Visual Thinking" is great.
OR
Data Flow 3: Data, Design & Desire
OR
Data Flow 3: Graphic Design to make sense
Hope you enjoy :)
I'm going with Data Ho. I can do that, it's nearly 5am.
OK, so yes, I too think they should continue to build upon the Data Flow series thing so that challenge is what to put after the colon.
Data Flow 3: Form AND Function
Data Flow 3: Aspirational design
Data Flow 3: What we aspire to
Data Flow 3: Finding meaning in data
Data Flow 3: Philosophy and wisdom
and last but not least - Data Porn (which it is!!)
Powering Data: the new power generation
Data Flow 3 : beyond the information landscape
Data Flow 3 : the art of displaying information
Data Flow 3 : information visual codex
Data flow 3 : When abstract data becomes art
Data Flow 3 : visualizing the invisible
Data Flow 3 : the essence of visualization
Data Flow 3 : at the edge of art and science
Data Flow 3 : the missing link between data and humans
'Data Evolved'
The way society views and interprets ideas and information is constantly changing, and so the creator must follow and meet the requirements of this society.
Data Flow 3: Imagineering Data
III
***
•••
\\\
>>>
...
"Glamour in data"
Data wolF
Data Flo3 (rotate the the "3" 90° clockwise)
Data Flow 3 .. yes please
DdDAaatttaa FfFlLloWOWow
DdDAaatttaa FfFlLloWOWow
Visual Datascape
Data Flow: With a Vengeance
Data Visions
Data Dreams
Data [Must] Flow
MDF: Meta Data Flow 3
DF3
Data Flood
Data Flow 3: imagine, create, inspire
Data Flow 3 : The Aesthetics That Move You
Data Flow 3: Harvesting data with images
or
Data Flow 3: Data blossoming
Thinking with Pictures
Data Flow 3: "Articulating Complexity"
The Data Are
Visual Refinement:
the art and science of data graphics
Visual Refinement:
the art and science of data graphics
- data.scapes
- data.code.information
- data or not data, data is the question.
Data Flow 3: The gates are open
Datascapes: Seeing the invisible
Data Flow 3: The Form of Data
Data Flow 3: Data Capture
Data Set Ready
The winners have been chosen. By courtesy of Gestalten Publishers, Michael Kelly, Neema and Hachem will each receive a Data Flow II book.
Congratulations!
How about:
Flowed Data,
Flowedata,
FloweData
or
Flowing Data
: tim
InfoCubed
DataCubed