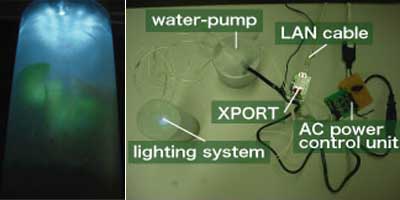
 a physical installation that integrates 'plants & digital media for ambient information visualization in real space'. its authors believe that because plants are grown with organic change, plant growth is well suited to visualize some sort of information like human relations & feelings. in practice, sensors measure everyday communication via mobile phones, which is then stored in a networked database. an RFID reader detects when users come home, & starts the actuator that embodies this information as growth of plants via a LED lighting system & a water-pump that controls the water supply. see also gori node garden, infotropism & spore 1.1 for conceptually similar plant displays. [|via ]
 Time and Date follows Time Zone (Brussels)
Wouldn't this (and similar projects) border on pseudo-science? This is what I mean. Quote:
"Since plants are grown with organic change, we think that the growth of plants is well suited to visualize some sort of information like human relation and feeling." keio.ac.jp
By making such a bold claim they should at least have a decent theory och hypothesis to back it up. This is what gives information and interaction design a bad reputation -- namely the lack of scientific credibility.
Though, it's a neat thing.