
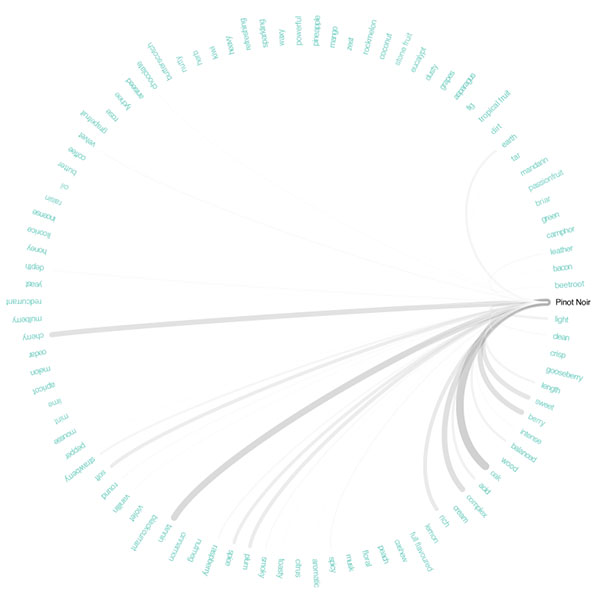
A relative simple circular visualization of the relationships between wine varieties and flavor components. The [tashian.com] shows the strength of these relationships, by parsing descriptive flavor words from over 5,000 published wine tasting notes written between in a major Australian wine magazine.
If you like this, you will also appreciate Alchemy of Fruit Juices, Food Pairing Networks and Taste Visualization in Animated Movies.
 Time and Date follows Time Zone (Brussels)
what program is used to create something interactive such as this? i can create static images w/ photoshop/illustrator but i hope to expand my repertoire... help?
Adobe Flash.
Thnkx little helper :)...