
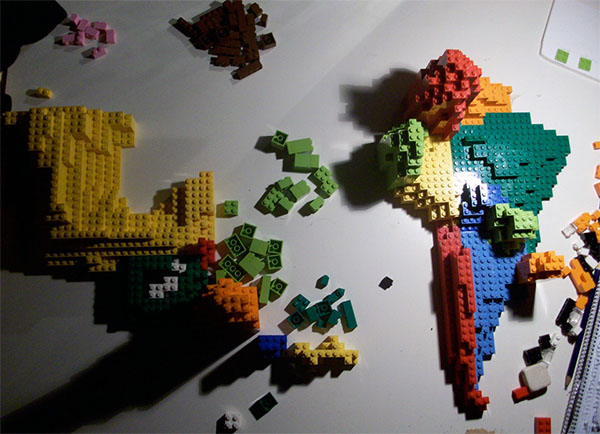
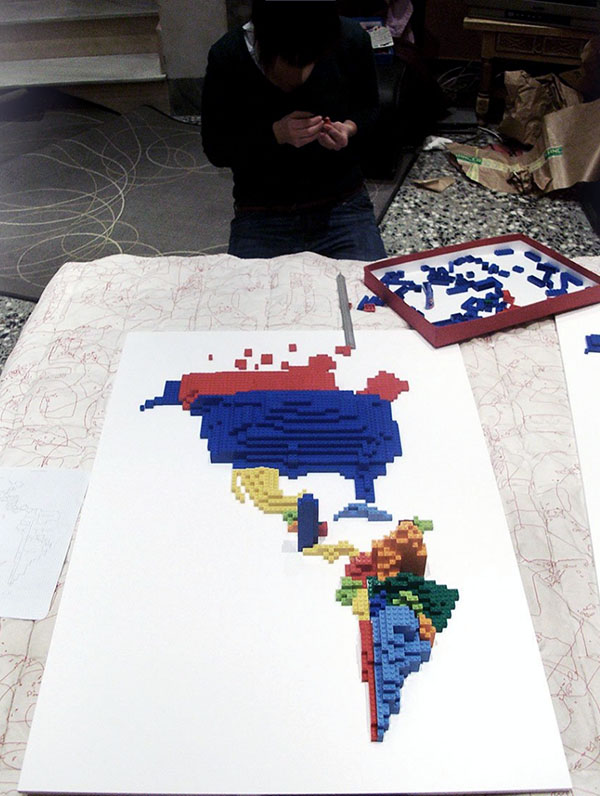
Samuel Granados has discovered an efficient way to display geographical data in 3D physical reality. [samuelgranados.es]. One side of the map reveals the emigrants of each zone, the opposite shows the immigrants (both represented by the volume of the pieces).
Via .
See also:
. New York in Lego
. Lego-Based Time Tracking
. Fight Club Narrative in Lego

 Time and Date follows Time Zone (Brussels)
Yes!
Pure data porn... I love it.
I love playing lego. I got to try this with my kid and build maps for educational purposes. Thanks for the great idea, this will also enhance ones creativity.
the internet with legos! http://www.vimeo.com/
I love Lego as you can probably tell from my site but this takes things to a whole new level. Data visualisation with Lego. Bloody genius!!! :P
I don't understand what sort of information you wanna show...
Nicaragua and Venezuela... Yes it's interesting