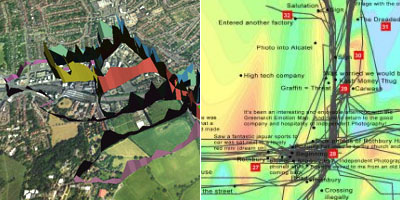
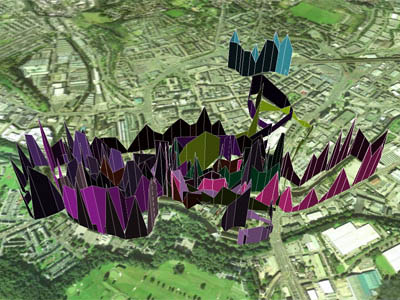
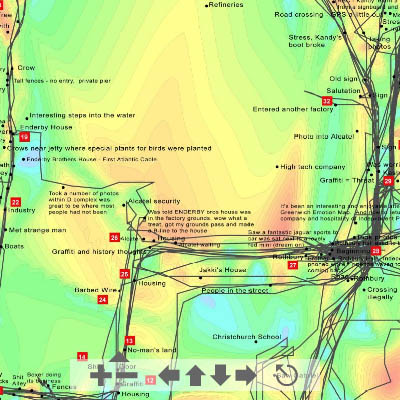
an interesting research project which explores how one can make use of the real-time biological information of the human body. several wearers record their Galvanic Skin Response (GSR) (a simple indicator of emotional arousal) in conjunction with their geographical location. this is used to plot a map that highlights points of high & low arousal, & visualizes where people feel stressed or excited.
the Greenwich Emotion Map project attempts to invent new visualization strategies to represent this data in the context of neighborhoods & communities.
see also bio-responsive server & coca-cola world chill map & gps drawing.
[ & ]
MORE
 Time and Date follows Time Zone (Brussels)
These are as useful as they are beautiful. I would love to see a much larger city like London, Washington D.C. or a hotbed of emotion like L.A. Would we see depressed or happy suburbs?
storygeek
Just to be picky I should point out that Greenwich is in London...